Forest loss around Gorongosa National Park
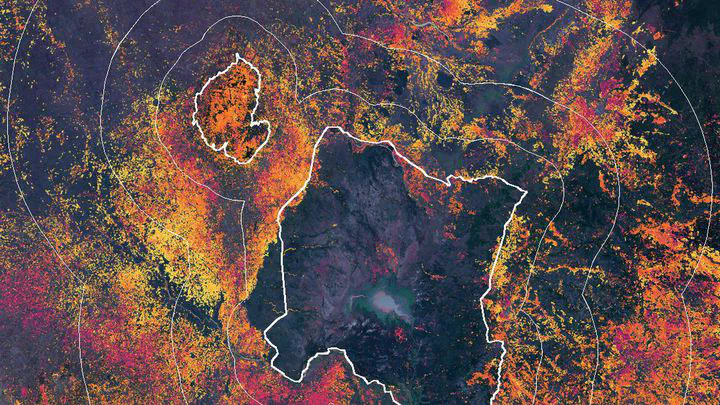 Forest lost between 2001 and 2025 around Gorongosa National Park
| At a glance | |
|---|---|
| Where | Gorongosa National Park and Mount Gorongosa, plus rings of 0–10, 10–25 and 25–50 km around them |
| Data | Hansen/UMD Global Forest Change v1.13 (30 m), WRI/Google DeepMind forest loss drivers, Sentinel-2, GHSL population, WDPA park boundaries |
| Tools | Google Earth Engine, Python, MapLibre for the full interactive map |
| Why | A side project. The full map compares five protected areas in Mozambique; this page shows only Gorongosa |
Protected areas are meant to keep their forest. But a park boundary is also a line on a map that people outside it have to live with. I compared forest loss inside Gorongosa with loss in three rings around the park.
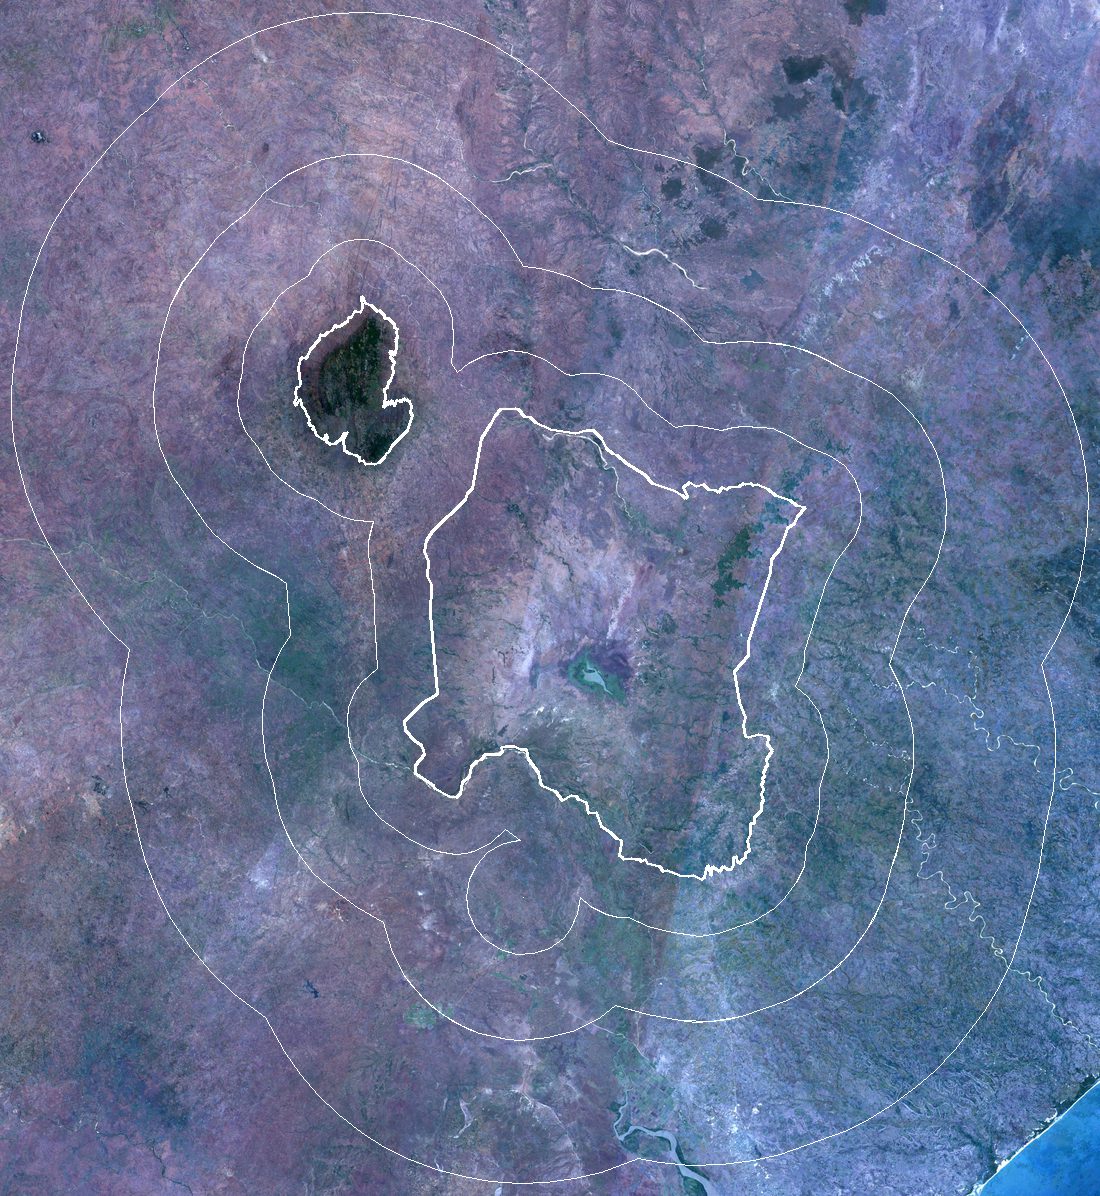
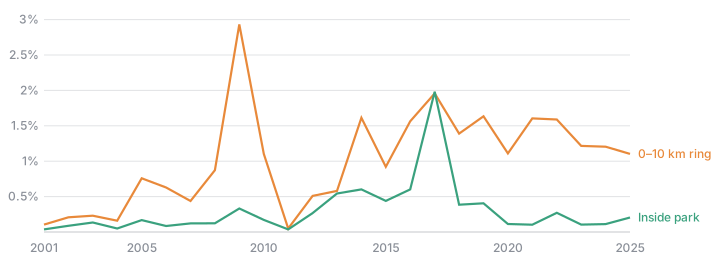
Inside the park, about 0.16% of the 2000 forest was lost per year in 2021–2025. In the first ring, up to 10 km from the boundary, it was 1.34% per year, about eight times as much. That ring has lost a quarter of its 2000 forest since 2001, and its yearly loss went up from 0.29% in 2001–2005.
More people live there too. The 0–10 km ring went from about 13 to 48 people per km² between 2000 and 2025 (GHSL, modelled). The WRI/Google DeepMind drivers map puts 84% of the loss in that ring down to permanent agriculture, which in this dataset includes smallholder fields that are not left fallow again.
The rings also contain most of the roads, towns and fields, so these figures show where the forest was lost, not why the park does better.
Related: Land-use change around Gorongosa